It’s no secret that Scala programming can have long compile times. We pay the price for advanced language features that let us write concise programs and eliminate entire classes of bugs.
But I want fast compiles and fancy language features. I want to have my cake, and eat it too.

Usually long compiles are not a big deal. Scala’s compile times have improved a lot over the years. With Scala’s incremental compilation you only need to re-compile the few files you changed, not the entire project. But Continuous Integration servers are not so lucky.
With experience you can learn what features are prone to slow compilation but it’s hard to prove and have confidence that your optimisations are worth it. That was until now, now the new IntelliJ IDEA has compilation charts which show unit (file) level compilation times. So we can easily find the slowest compiling parts of our code and make a few well placed changes to dramatically improve compilation time. This feature builds on scalac-profiling, which generated flame charts.
IntelliJ Scala Compilation Chart
You can find the Compilation Chart by rebuilding the project and looking in the “Build” tab and in “Chart”.
I’ll use my project Real Email as an example. It’s a web API that validates email addresses and records stats. It’s relatively simple for a Scala project, being 100 files and 8000 lines of code. It already builds quickly at 12 seconds. But we can make it much faster. The same optimisation techniques can be applied to larger projects.
Modules, Phases and Units
IntelliJ’s “Modules” view shows different project modules. I only have 2 modules: main source, and test source. But if you have multiple this chart can show you what modules are compiled in parallel. You can move code dependencies to improve compilation parallelization.
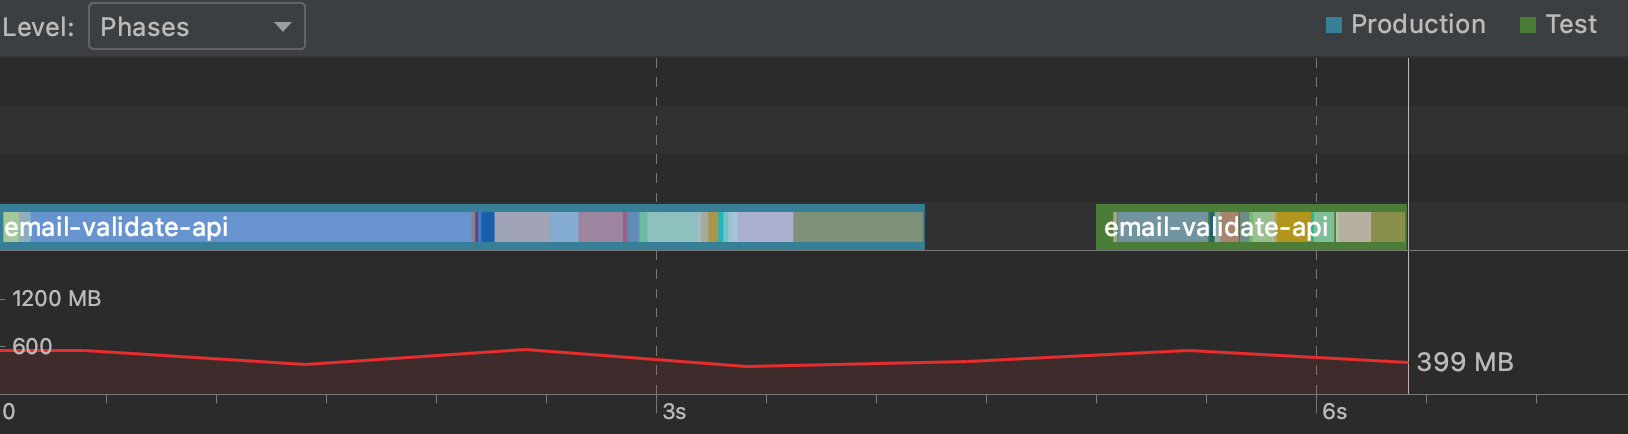
IntelliJ’s “Phases” view shows the Scala compilation phases for each module. Typer is the main phase we have control over, it’s where all the type checking and implicit search happens. Typer is always the slowest but if it’s very high (like over 70% of the time) it’s a good sign something crazy is going on.
The “Units” view shows individual files at each phase. Each file is represented as an inner black line. Look for the longest lines. I have 100 files, but only a dozen stand out without zooming in.
I’m going to focus on AppContext.scala and FlywayContext.scala which together take about 1 second to compile.
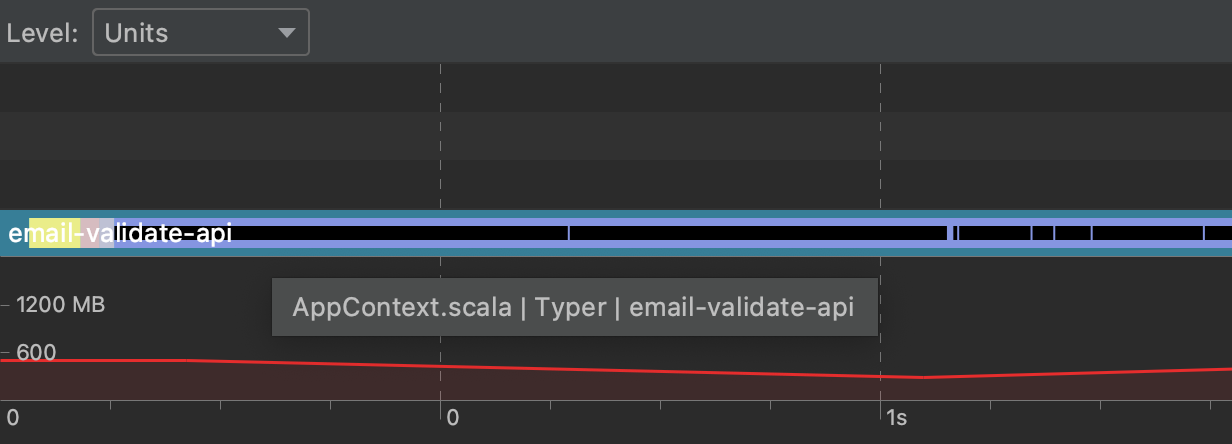 Hovering over AppContext.scala, the first black line.
Optimising Scala Compile Time
Now that we know what files are slow, we need to find exactly what code in each file is making it slow.
Optimising Scala Tips
- Macros and implicit search used together. Implicit search, macros and Type Classes are fine on their own, but if the implicit search is triggering macros like in Shapeless compile time can blow out. Automatically parsing things like JSON into case classes is a common use case.
- Orphan typeclass instances. Put your implicit instances in the companion object if you can. This is the first place implicit search looks before searching other imports based on scope. This also removes ambiguity, you don’t want the order of imports determining which instance is found.
- Unused imports or code. Compile less code to save time. This also limits the search space for implicit resolution. Use Scalac’s
-Ywarn-unusedoptions to help. - Put explicit types on public class members, and set private members private. Reducing the public API surface helps incremental compilation avoid recompiling users of a class.
- Organise modules and code so more modules can be compiled in parallel.
- Type level programming which is complex and being based on implicit search subtle changes to the search order can have a big impact. Eg in JSON codec derivation
In my project, AppContext.scala and FlywayContext.scala together take about 1 second to compile. I’m using PureConfig to load config files as case classes using automatic type class derivation, which behind the scenes uses macros and implicit search.
In the code this is done with the two lines:
import pureconfig.generic.auto._
val config = pureconfig.loadConfigOrThrow[Config]
The loadConfigOrThrow function takes an implicit parameter implicit reader: Derivation[ConfigReader[Config]]
Because I haven’t defined a ConfigReader myself, the implicit search is going to find one via the generic.auto._ import which uses Shapeless’s macros. So to optimise this, I’m going to define my own ConfigReader for my Config case class in its companion object. PureConfig makes this easy with the ConfigReader.forProductN methods. Implicit search is still used to find the right ConfigReader for each field, but that can be done without the expensive macro expansion.
For example in my nested smaller config case class Db. I need to define a ConfigReader.
case class Db(jdbcConnectionString: String, username: String, password: String)

object Db {
  implicit val configReader: ConfigReader[Db] =
    ConfigReader
      .forProduct3("jdbcConnectionString","username","password")(Db.apply)
}
My change was as simple as removing the generic.auto._ import from AppContext and FlywayContext and defining the ConfigReader’s.
With this change, the compile time for those files comes down from 1 second to about 100ms. For the small cost of adding some boilerplate, we gained considerable compiler speed.
I was able to apply the same optimization to my Circe JSON codecs and bring the total compilation time down from 12 to 7 seconds. So that’s a 40% 💪 time saving with just a little bit of simple refactoring.
Conclusion
IntelliJ’s build chart is great. Now we have an easy way to see the hidden compile time cost of different ways to write code, and we can make an informed tradeoff. Im looking forward to using this on my other project which takes 20 minutes to build. Let me know if you have any cool stories where a small code change has made a big compile time difference.
If you liked this article and want more scala tips, follow me on twitter @hi_stephen_n 💙