GeoNet have this awesome heat map of earthquakes around NZ
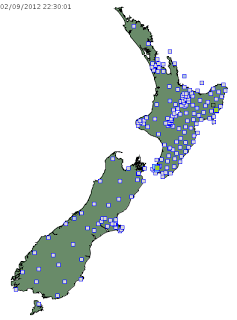
I thought it'd be cool to make a video of it. To show how that changed over time. So I did.
Unfortunately I've only got the aftermath. But I'm sussed to make cool videos next time.
All I had to do was download that png a million times. Then make the video with mencoder like this.
mencoder "mf://*.png" -mf fps=10 -o output.avi -ovc lavc -lavcopts vcodec=mpeg4